The year 2020 witnessed a human and economic crisis across the world due to the Covid-19 global pandemic. It disrupted economic activity, travel, supply chains and many more. Governments across the world tried to tide over the crisis by implementing lock downs, various stimulus measures and finally by creating the fastest ever vaccine solution. The human civilisationis still struggling hard to come out of this challenging situation.
The objective of this report is to find out where do we stand at present in terms of economic activity, financial asset market condition, investment risk and opportunity just after one year of Covid-19. We will also find out how we should position our portfolio based on the current circumstances.
Global Economy at Present
A sharp recovery in economic activity in US and China driven by massive government spending and a rapid vaccine rollout, is already rippling around the world. At present all major economies across the world are witnessing a robust economic recovery.
The discussion below will help us to find out to what extent economic activity bounced back so far and the cost involved.
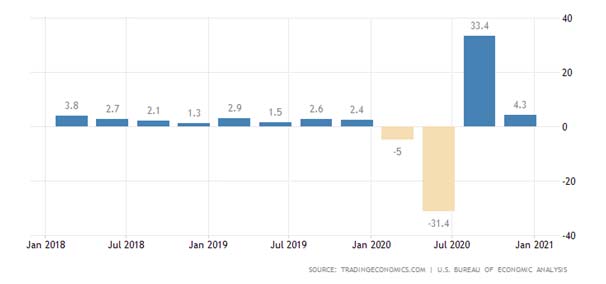
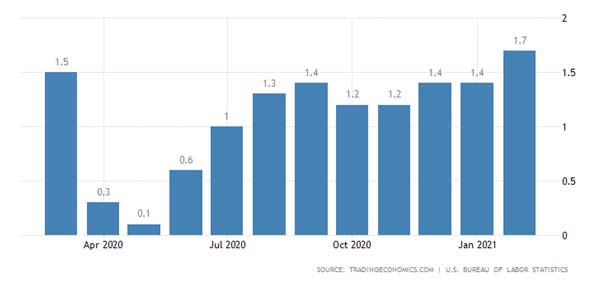
The US economy expanded at an annualized 4.3% on quarter in Q4 2020. Still, the expansion was slower compared to a record 33.4% growth in Q3 as the continued rise in COVID-19 cases and restrictions on activity moderated consumer spending. The outlook for 2021 seems brighter than a few months ago as the vaccination campaign continues, the $1.9 trillion aid bill was approved and Americans already started receiving and spending stimulus checks. [source: U.S. Bureau of Economic Analysis ]
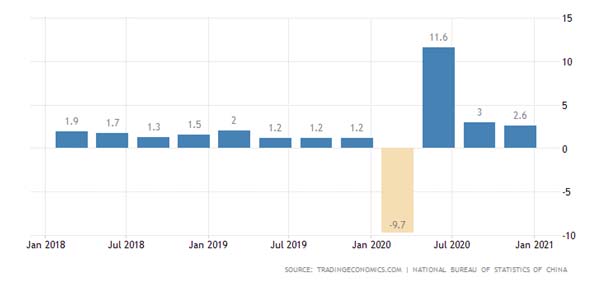
The Chinese economy grew by2.6 percent in December quarter 2020, following an upwardly revised 3 percent advance in the previous quarter. This was the weakest quarterly growth since a contraction in the first quarter of 2020. For full 2020 however, the economy expanded 2.3 percent and China is likely to be the only major economy to avoid contraction due to the COVID-19 shocks. [ source: National Bureau of Statistics of China ]
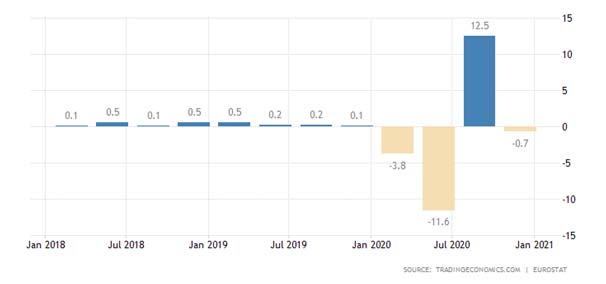
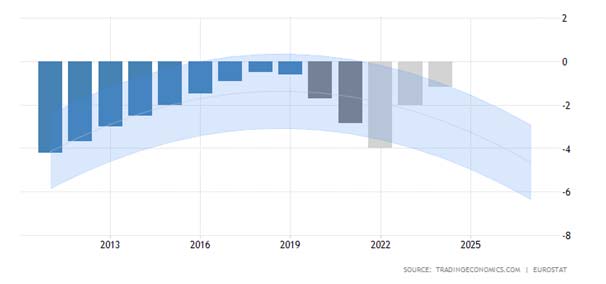
The Eurozone economy shrank by 0.7 percent in the fourth quarter of 2020, following a record 12.5 percent expansion in the previous three-month period and an unprecedent 11.6 percent contraction in the second quarter due to the COVID-19 crisis.
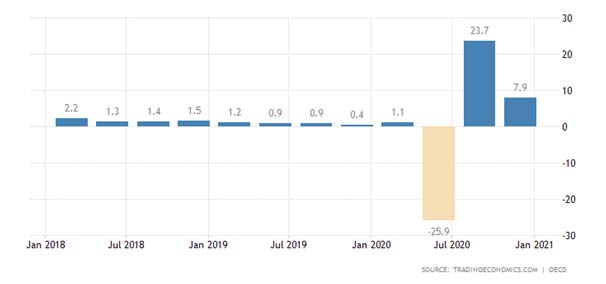
The Gross Domestic Product (GDP) in India expanded 7.90 percent in the fourth quarter of 2020 over the previous quarter. [ source: OECD ]
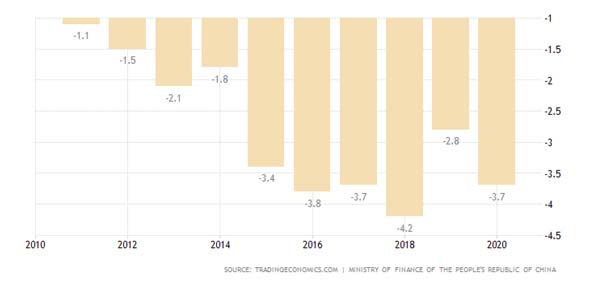
Government Budget deficit in China expanded to 3.70 percent of GDP in 2020 from 2.80 percent of GDP in 2019.
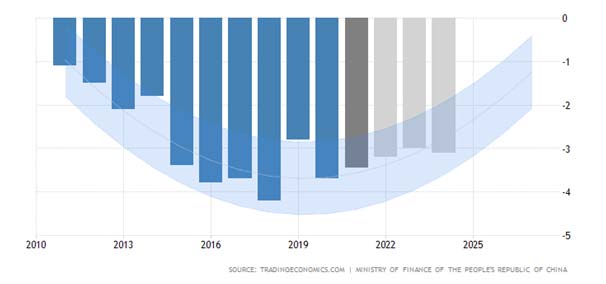
Government Budget deficit in China is expected to reach 3.20 percent of GDP by the end of 2021,In the long-term, the China Government Budget is projected to trend around 3.00 percent of GDP in 2022 and 3.10 percent of GDP in 2023
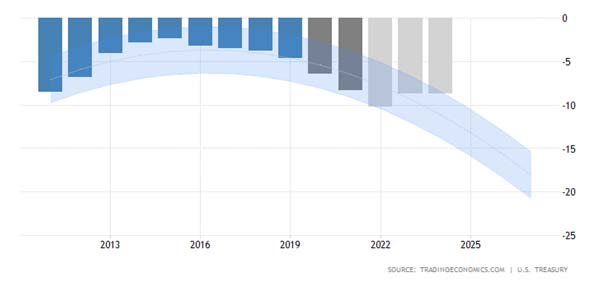
Government Budget deficit in Euro Area is expected to reach -4.00 percent of GDP by the end of 2021,In the long-term, the Euro Area Government Budget is projected to trend around -2.00 percent of GDP in 2022 and -1.20 percent of GDP in 2023.[ Source -Trading Economics ]
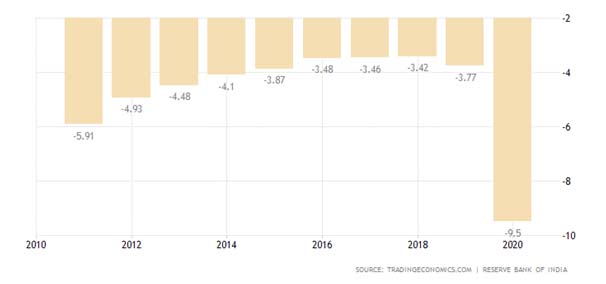
India’s government budget deficit is projected to increase to 9.5 percent of GDP in the 2020-2021 fiscal year, up from 3.8 percent in the previous fiscal year and well above the government’s forecasts of 3.5 percent according to preliminary data from the Ministry of Finance. That would be the largest budget deficit on record, as the Covid-19 pandemic severely affected the government revenues while exerting pressure to increase public expenditure. [ source: Reserve Bank of India ]
From the above discussion we can understand, there is such a huge spending program taken up by the Governments of the major economies. Hence it will trigger sudden demand across all the economy ( scale will be different ). Such demand will not only be limited to the basic consumption space but also trigger the industrial activity or the investment demand. Most importantly all such spending activity is taking place across the world at the same time on an average. According to Organization for Economic Cooperation and Development ( OECD )The U.S. economy is expected to grow by around 6.5% this year and such thrust will push the US economy much ahead of the pre-pandemic situation. And such growth in US economy will have rippling effect across the world particularly emerging economies. Countries like Vietnam, Thailand, Taiwan among other South East Asian economies will be benefited.
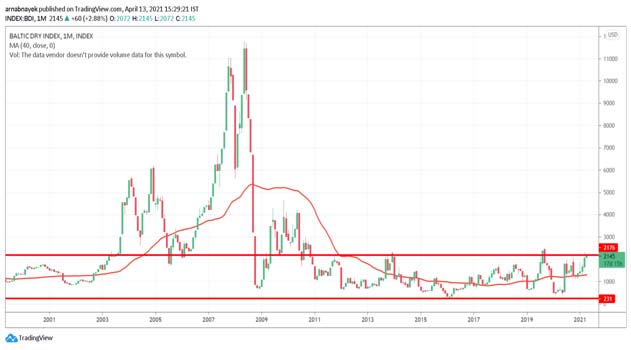
Industrial Commodities and minerals seeing huge demand due to massive infrastructure spending and it is likely to sustain at least for 2 years. Money has started rolling as the economies are opening up ( scale is different ) and will create a multiplying effect. Just imagine the impact when all the economies will open up fully , international travel will be a regular affair. But it will take some time.
Present economic situation is different than the post recovery phase of previous financial crisis. In 2009 and during later period central banks supplied huge amount of money to the economy by various means such as purchasing bonds, lowering interest rate etc but capacity was ready to take care the increased demand due to increased money supply. Major industries had already added huge capacity based on economic growth during the period 2005—2009. Hope we remember it was the period when Tata Steel bought Corus in UK one of the largest acquisitions by TATAs. Tata Motors bought Land Rover & Jaguar. Many more such examples can be given in India only. As a result, balance sheet of most of the companies got stretched with huge debt and became unsustainable due to the worldwide recession. In last 10 years companies were busy restructuring their balance sheet. Supply side faced no problem as there was no demand acceleration and additional capacity was already created. Interest rate reduced to zero and even negative in most of developed economy to support growth by the Global Central Banks. Before pandemic also central banks were never sure when the demand will revive.
Much awaited demand is here. Thanks to enormous Govt spending during last one year, ultra-loose monetary policy of the central banks. According to US Fed supported by European Central Bank, they will continue with such accommodative monetary policy for at least next 3 year. At present Govts are spending huge amount of money ( More than $2 trillion expected to be allocated in infrastructure ) in different areas such as health, physical infrastructure & technology remains the primary area where the spending is happening and will happen in foreseeable future.
Hence the economic activity expected to remain strong in coming years.
Turning Points or Risk Factors —
Need to keep an eye in the following area which can halt the growth path and rally in the riskier asset class.
- Inflation& Bond Yield—
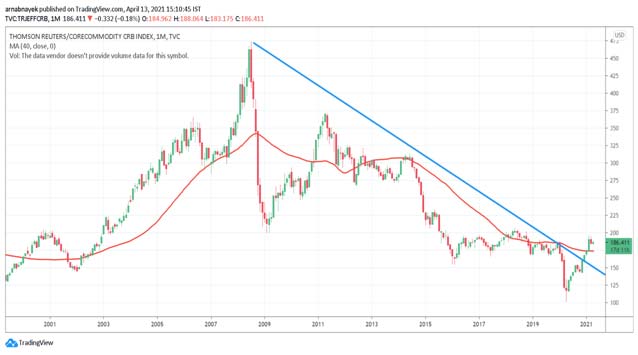
Some amount of inflation is surely good as it is a sign of growth. But not beyond a point because then it will reduce the purchasing power of the consumer and central bank will have to increase the interest rate. At present agricultural and industrial commodity prices are going up across the world. Below is the Thompson Reuters commodity price index which tracks the price movement of 19 major commodities which includes agricultural commodities,minerals, metals,crude oil etc. Post 2009 commodity prices across the globe was in a correction mode due to recession and excess supply. But from 2020 June onwards it started rising and broke the almost 10-year-old primary trend line. Currently it is trading around pre-pandemic level. Such upward movement in commodity prices will increase the general inflation in the economy. We must remember this inflation is due to higher demand. Now there is another problem currently faced by the global industries—supply side problem. Issues like bad weather IN US ports, shipping line problem, conflict between US and China etc are disrupting supply chain across the world.
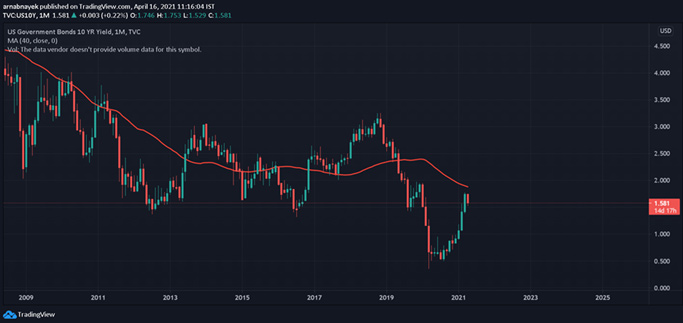
Bond Yield Movement
Expected upward pressure in inflation is already anticipated by the bond markets across the world.US 10year Govt Bond yield is rising since last Dec 2020 presently in the range of 1.65—1.75 percent. It went down to 0.5% during the pick of the pandemic last year. Any sustained rise beyond 2% will threatened the rally in equity market specially the emerging market. Rise in cost of capital in developed world will cause dollar going back home from the riskier market.
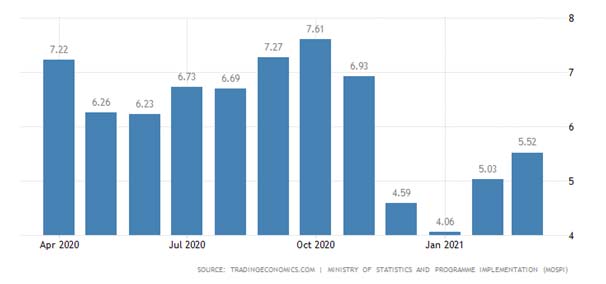
10 Year G-Sec yield movement in India is also causing some discomfort to RBI. Indian central bank is trying its best to keep the yield stabilise through various conventional and unconventional measures. Detailed discussion on those measures and its impact on the economy will be discussed in a later article. Currently the 10year G-Sec is in the range of 6.25—6.5. Up from its low of 5.70—5.75. Any movement beyond 7% will threaten the rally in the riskier asset class. Any sharp movement will make things much worse.

Note : In most of the graphical representation time horizon selected is 10 year or more to give better understanding of the movement of the underlying variable.
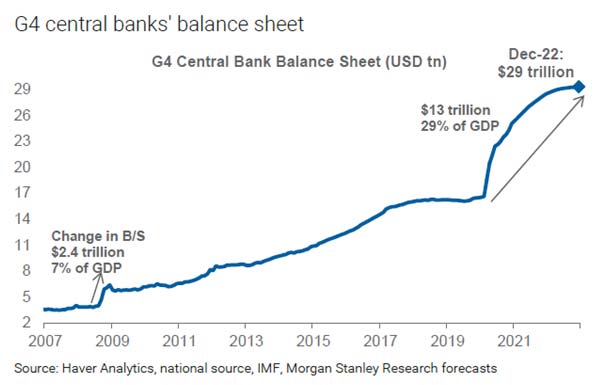
B. Reduction in Bond Purchase Program and Rationalisation of Fiscal Stimulus
In the last decade, the agenda of Central Banks across the world was to bring back growth. Enormous amount of fiscal stimulus was given. It created a huge amount of liquidity. Huge money flowed into the risky asset class. Any change in that stance by the Central Banks will impact the rally in risky asset class. The picture below explains it all.
C. Movement of Dollar Index
Dollar Index corrected by almost 12% from 102 to 89 on the back of strong monetary stimulus by US Fed. This helped money flow in emerging markets. Any strong upward movement will impact the rally in emerging market. Currently dollar index is trading at 91—92. Dollar index moving above 100 will create some volatility in the emerging market.
Asset Market Out Look& Portfolio Allocation
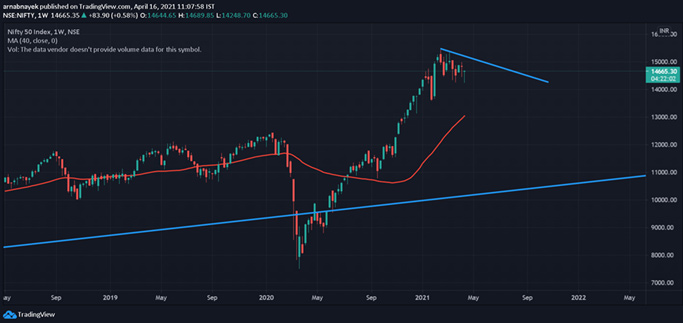
Equity
Equity markets are rallying across the world. Which is the reflection of the increasing economic activity. It is also discounting a certain level of expected economic growth at present price. Indian equity market may see some consolidation going ahead due to second wave of covid surge. It will be an opportunity to add equity in the portfolio If Nifty comes down to 11500—12500 range. Currently Nifty is trading at a PE of 32 with respect to its 5 year average 27 and Price to Book is 4.15 with respect to its 5 year average 3.46. Nifty earning yield is 3.1% and one year risk free rate on an average is 4.5—5%. Overall it indicates Indian equity market is not terribly expensive given the future growth prospect but not a bargain also at this point of time. One time investment should have a time horizon of at least 5 year. One should add equity in the portfolio keeping in mind the overall portfolio risk exposure if there is a correction.
Debt Market
Indian debt market at this point is standing at bottom of the yield curve. Given the current situation it can be safely assumed that interest rate has bottomed out for the time being. Longer end of curve (10 years and above ) might not get impacted much but at the shorter end some upward revision is expected. Hence it is better to play the shorter end of the curve. Duration can be added in the portfolio through G-Sec as the yield moves up in the future and will be advised accordingly.
Gold
Gold as an asset class should be used to hedge the portfolio risk against any uncertainty. If Equity is a part of your portfolio, Gold should also be a part. But we have to remember investment in this asset class does not generate any regular cash flow. Hence allocation to gold should be decided based on the strategic asset allocation in the portfolio or else it will be a drag in the portfolio. Currently international Gold price has corrected by almost 20% from its pick of $2075/ Oz. As economic growth is coming back and interest rate is also not likely to fall in the immediate future it is expected Gold might move sideways to downward. Small addition depending on the requirement of the portfolio should be considered if there is further correction in the gold price.
